Here is the problem at the center of every energy project: you cannot measure savings. You can measure consumption. Savings are the difference between what you used and what you would have used — and the second number never happened. It is a counterfactual, and it has to be constructed, defended, and adjusted. That construction is what measurement and verification is.
Why this is harder than it sounds
A building’s consumption moves for reasons that have nothing to do with your project. A hotter summer. A new tenant on the third floor. A vacancy. Longer hours. Add a control strategy in a mild year and you will look like a genius; add the same strategy in a brutal one and you will look like a fraud. Neither impression is about the strategy. M&V exists to strip those effects out so the remainder can be attributed honestly.
IPMVP, in plain terms
The International Performance Measurement and Verification Protocol is a framework, not a law. It does not tell you what your savings are — it tells you how to argue for them in a way another professional can check. Its main contribution is a shared vocabulary for the four ways to draw the boundary:
- Option A — retrofit isolation, key parameter measured. Measure the parameter that matters most; stipulate the rest from reasonable assumptions. Cheap, and only as good as the stipulations.
- Option B — retrofit isolation, all parameters measured. Meter the affected equipment properly. More expensive, far more defensible for a single well-bounded measure.
- Option C — whole facility. Use the utility meter and a regression model of the baseline. The right tool when many measures interact and you cannot isolate them — which describes most real operational programs.
- Option D — calibrated simulation. Model the building and calibrate the model against measured data. Powerful where no clean baseline exists; also the easiest to abuse.
The baseline is the whole argument
Every savings claim rests on a baseline period and an adjustment model. If someone shows you savings without showing you both, they have shown you a difference, not a saving.
Routine adjustments handle the things you expected to vary — weather, occupancy, operating hours. Non-routine adjustments handle the things you did not — a floor that went dark, a chiller that failed, a tenant that doubled.
Our own number, held to the same standard
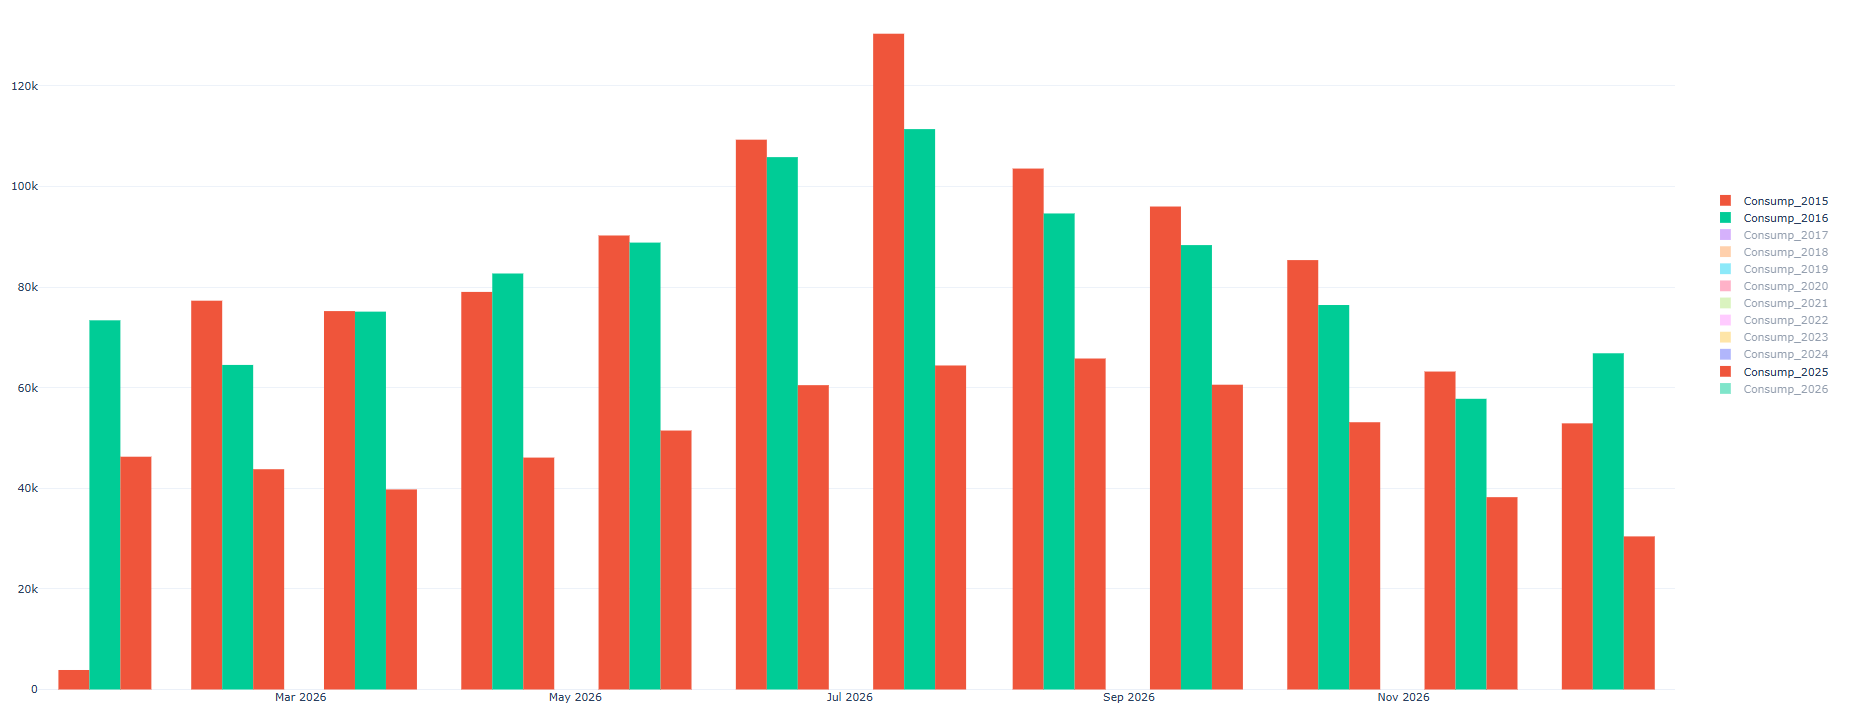
We publish that yearly energy consumption at 800 Wilcrest Dr fell roughly 50% between 2015 and 2025. That figure is time-normalized, not weather-normalized, and we say so every time we use it. Under a strict Option C treatment it would be regressed against degree days and adjusted for occupancy, and the number would move — possibly up, possibly down. We are comfortable with that, because the alternative is a marketing claim dressed as a measurement, and the whole point of running buildings on data is that we do not get to do that.
The full account of where that reduction came from — almost none of it from buying equipment — is in the energy-savings write-up.
What to demand from anyone claiming savings
- The baseline period, and why it was chosen.
- The measurement boundary — what is inside the claim and what is outside it.
- The independent variables in the adjustment model, and the model’s fit.
- The non-routine adjustments made, each one named. This is where inconvenient facts get quietly absorbed.
- Who did the analysis — and whether they are paid on the result.
That last one is not cynicism; it is basic hygiene. A vendor verifying their own savings is not a verification.
Do you need this if you are not chasing an incentive?
Yes, and for a selfish reason. M&V is how you find out which of your measures actually worked, so you can do more of the ones that did. Without a baseline and a model, a portfolio of measures becomes a single undifferentiated blur, and next year’s budget gets allocated on vibes. It also does most of the work required for ESG reporting, which needs the same data lineage. The tooling for all of it is the same EMIS layer — and choosing one that supports real baselining is covered in the buyer’s guide.
Efficiency through data — including the inconvenient data
We publish our methodology and its caveats because a savings number without one is a slogan.
See the 800 Wilcrest results Where the savings came from