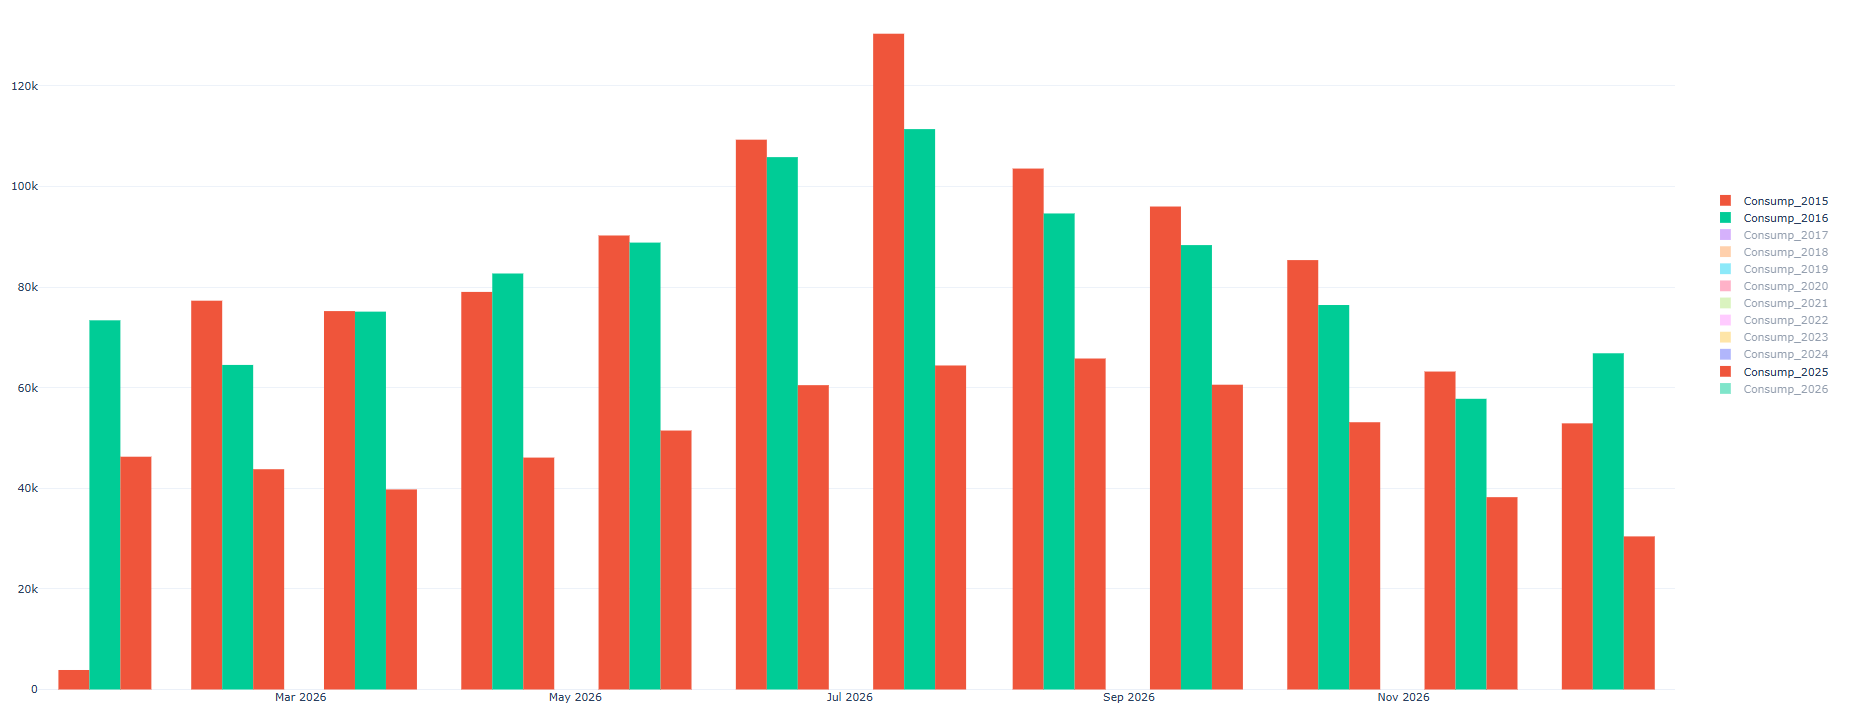
Most energy-savings conversations start at the wrong end. A vendor arrives with a product, the product implies a capital project, and the capital project implies a payback model built on assumptions nobody will ever check. The buildings that actually get cheaper to run tend to do the opposite: they measure first, operate better, and buy last.
The savings hierarchy
- Free. Schedules that match real occupancy. Setpoints that are not fighting each other. Equipment that stops at night. This is the largest single bucket in most buildings and it costs nothing but attention.
- Cheap. Resets, staging, economizer repair, sensor calibration, fault detection. Small labor, no capital, immediate.
- Capital. New equipment. Sometimes genuinely necessary — and almost always oversized, because it was specified against a building that had never been operated properly.
The order matters more than any individual measure. Buy a high-efficiency chiller for a building running 24/7 on bad schedules, and you have bought a more efficient way to waste energy. Fix the schedules first and the chiller you actually need is smaller and cheaper.
The rule we operate by
You cannot manage what you do not measure — but you also cannot justify a purchase you have not first tried to avoid.
Every capital request should have to survive one question: what happens if we operate the building correctly for six months first?
What the data actually looks like
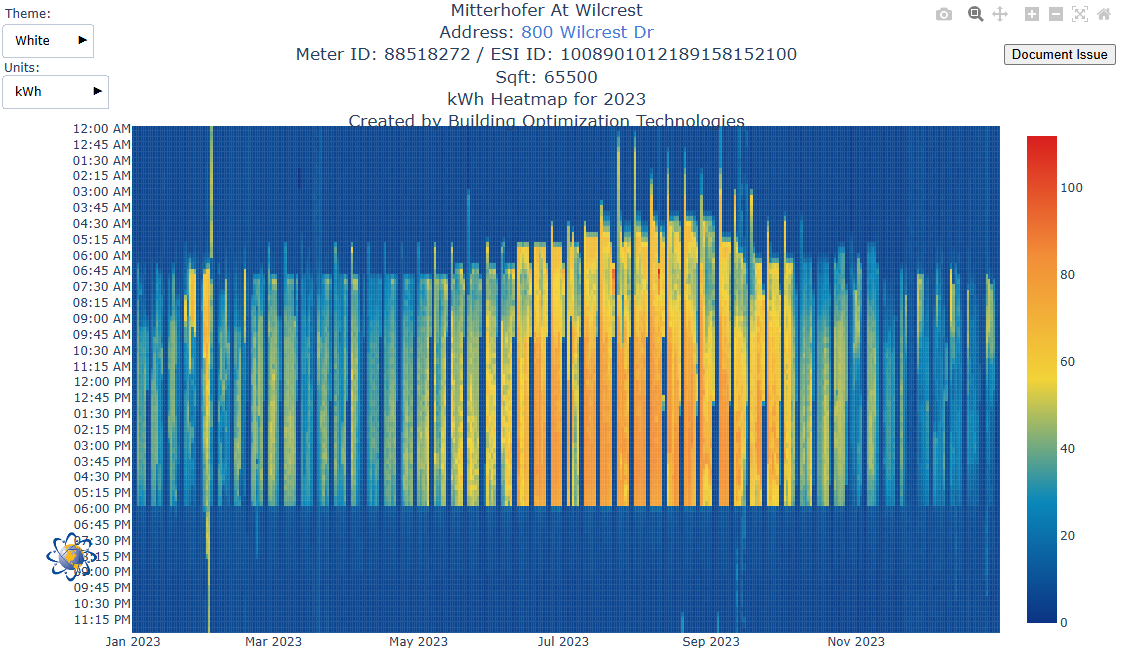
A year of interval data at 800 Wilcrest Dr, hour by hour. The dark bands are the building asleep — which is the point.
An interval heatmap is the most honest diagnostic in building operations. It shows the nights and weekends where equipment should be off and is not, the pre-occupancy ramp that starts three hours too early, the tenant floor that never quite stops. None of that shows up on a monthly bill. All of it shows up here, and most of it is free to fix.
Where the savings came from at 800 Wilcrest
- Schedules matched to reality — not to the schedule that was programmed at commissioning and never revisited.
- Setpoint and reset strategies — supply air and water temperatures that move with load instead of sitting at a fixed number chosen in 2009.
- Staging and sequencing — the right equipment running, in the right order, at the right capacity. Covered in the HVAC optimization guide.
- Fault detection — a stuck damper or a flat sensor costs money quietly, for years, until something is watching for it.
- Peak discipline — managing the fifteen minutes that set the demand charge and the four summer intervals that set the 4CP transmission bill.
- Continuous attention — the unglamorous one. Buildings drift. Optimization that is not maintained decays back to its commissioning day within a couple of years.
The honest caveat
Our figure is time-normalized, not weather-normalized. A hotter decade would have made the same operational improvements look smaller, and a milder one would have flattered them. We say so, in public, because a savings number without its methodology is marketing. If you are evaluating anyone’s savings claim — including ours — the measurement and verification guide is the right lens, and it is the discipline that separates a defensible number from a nice one.
What it takes to do this in your building
None of this requires a product with “smart” in its name. Three things, in order: visibility (interval data, trended points, and a place to look at them — see the EMIS guide), control (a building automation system that can actually act on what you learn), and an owner — a named human whose job includes tuning the building after the consultants leave. Skip the third and the first two decay into a dashboard nobody opens.
The portfolio is the proof
Four Class A buildings in West Houston, run on this method by their owner’s own operations arm — with the results published, not pitched.
See 800 Wilcrest Dr Start with HVAC optimization