Investors ask for it, corporate tenants require it of their landlords, and a growing set of jurisdictions mandate benchmarking outright: commercial buildings increasingly have to report their environmental performance, credibly and repeatably. “ESG reporting software for buildings” is what people search; what they need is a working pipeline from meters to metrics to disclosure.
The metrics that anchor building ESG
- Energy Use Intensity (EUI) — annual energy per square foot; the universal comparison stat.
- GHG emissions, Scopes 1 & 2 — direct fuel combustion on site (Scope 1) and purchased electricity (Scope 2); tenant activities ripple into Scope 3.
- Benchmarking scores — ENERGY STAR Portfolio Manager is the de facto U.S. registry; many disclosure regimes build on it.
- Water and waste — secondary in most office reporting, first-class in some frameworks.
What the software layer actually does
Good reporting tools do four jobs: aggregate utility and meter data across a portfolio, normalize it (weather, occupancy, floor area), map it to frameworks and benchmarking systems, and produce disclosures auditors and counterparties will accept. Valuable — and entirely downstream of the real constraint:
The uncomfortable truth about ESG reporting
Reporting software cannot report data you don’t collect. Annual utility bills give you twelve numbers a year per meter — enough to disclose, useless to manage.
Buildings with interval metering and continuous monitoring get both: defensible disclosures and the operational visibility to actually improve the numbers year over year. That second part is what stakeholders are really asking for.
TRY IT LIVE
Energy Heatmap apparatus
A year of one of our buildings as a single picture, built from live 15-minute interval data — the granularity that separates a defensible disclosure from twelve utility bills.
Open the heatmapTRY IT LIVE
Reading a Model
An interactive walkthrough of R², RMSE, CV(RMSE), and NMBE, with IPMVP Option C compliance — the statistics behind whether reported energy performance holds up.
Try the model metricsA pragmatic path for owners and operators
- 1. Instrument first. Interval electric metering (and gas/water where material), flowing into a system of record — the EMIS layer.
- 2. Benchmark. Stand up Portfolio Manager (or your jurisdiction’s registry) with clean square-footage and occupancy data.
- 3. Fix the operational waste. Optimization improves the metrics before any capital project — the cheapest emissions cuts are schedules and setpoints.
- 4. Report from the same pipe. When disclosures and operations share one data source, the numbers reconcile and the audit is boring — the good kind of boring.
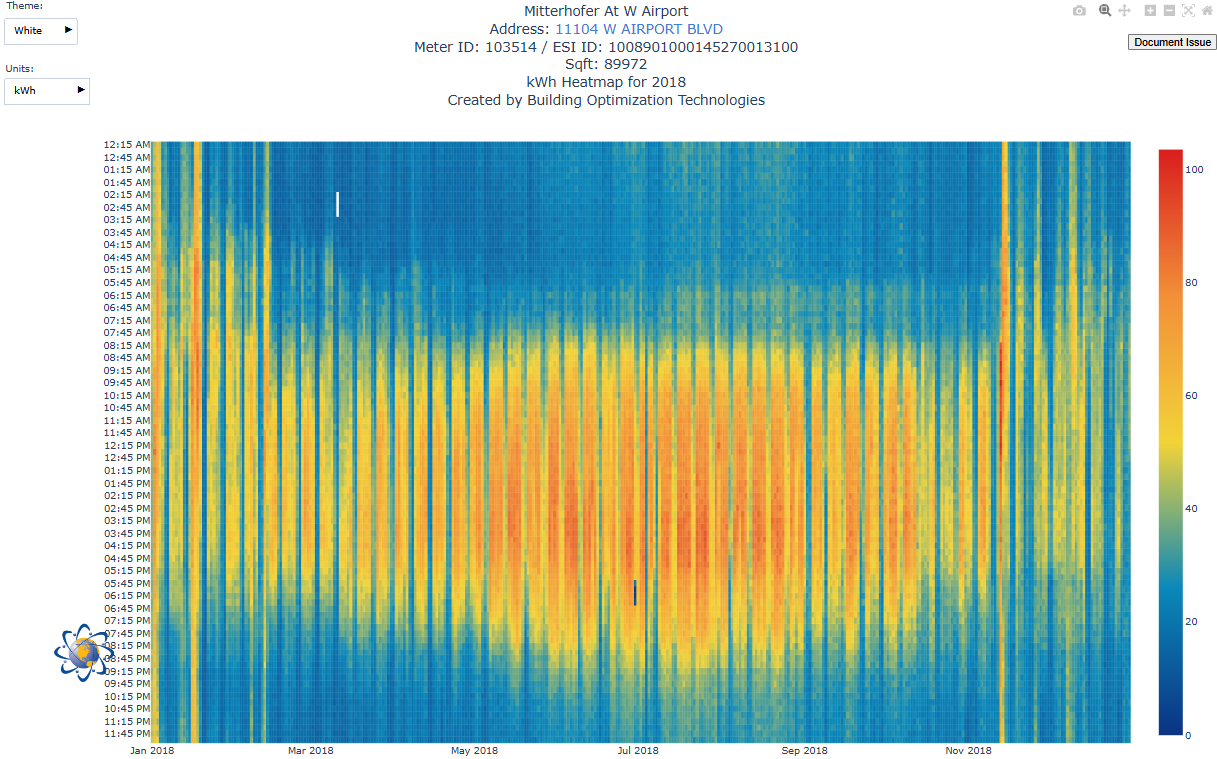
MEASURED RESULTS
2018: baseline at acquisition
Interval kWh heatmap of 11104 West Airport (~89,000 SF) the year we acquired it — 27 rooftop units with poor scheduling and visible off-hours and weekend waste.
See 11104 West Airport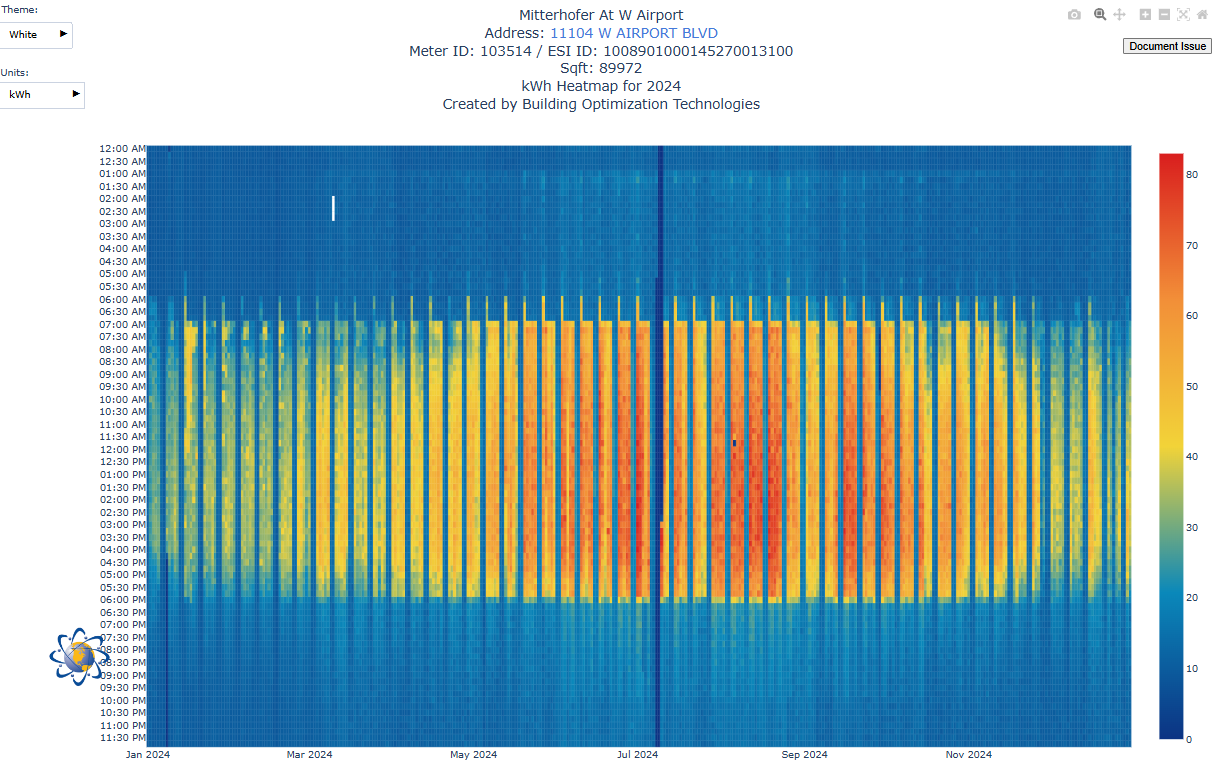
MEASURED RESULTS
2024: instrumented operation
The same building with custom smart thermostats on all 27 RTUs, defined operating windows, and strong night setback — annual electricity down ~36% from 2018 to 2025 (time-normalized).
See 11104 West AirportHow we handle it
Our four West Houston buildings run on continuous energy monitoring under Building Optimization Technologies — the same interval data that drives daily operations can back reporting, and the discipline shows up where tenants feel it: efficient buildings and predictable rates. For corporate tenants whose own ESG programs count leased space, a data-instrumented landlord is quietly one of the easiest boxes to check.
Tenant ESG asks about your office footprint?
Leasing in a continuously monitored building makes the leased-space chapter of your report straightforward.
See the buildings How the measurement worksDisclosure requirements vary by jurisdiction and framework and change frequently — verify current obligations for your locations rather than relying on any general article, this one included.