The market for “energy management software” is crowded and the term is baggy, so let’s pin it down. An EMIS — energy management (and) information system — is the analytics layer of a building: it ingests interval data from meters and the building automation system, and turns it into baselines, comparisons, anomalies, and reports. The BAS acts; the EMIS knows. High-performing buildings need both, talking.
What the analytics layer actually delivers
- Interval visibility. Consumption and demand in 15-minute resolution — the difference between “the bill went up” and “something new runs every night at 2 a.m.”
- Baselining and normalization. Models of what the building should use given weather and occupancy — the yardstick that makes savings claims measurable (the same logic M&V practice formalizes).
- Anomaly detection. Automatic flags when tonight’s load doesn’t look like the model — drift caught in days instead of discovered on a quarterly bill.
- Demand analytics. Peak profiles, threshold alerts, and — in Texas — 4CP-season awareness for the afternoons that price the year.
- Reporting. Portfolio rollups, benchmarking feeds, and the data backbone for ESG disclosure — one pipe serving operations and reporting alike.
TRY IT LIVE
Energy Heatmap apparatus
Live 15-minute data: a year of any of our buildings as one picture — the interval visibility this guide keeps talking about.
Open the heatmapTRY IT LIVE
Reading a Model
R², RMSE, CV(RMSE), NMBE and IPMVP Option C compliance — the metrics behind every baseline an EMIS shows you.
Explore model metricsChoosing one: the questions that separate the field
- “Where does the data come from — and can I keep it?” Open integration with your meters and BAS, and full export of your data. Walk away from anything that traps history in a vendor console.
- “What resolution, how far back?” Interval-level, retained for years — baselines and diagnostics are only as good as the history beneath them.
- “Who responds to what it finds?” Name the human. An unwatched EMIS is a subscription, not a system.
- “Does it fit the building I actually have?” A four-building portfolio needs different machinery than a national REIT. Right-size — sophistication you won’t staff is shelfware.
The uncomfortable secret of energy software
Software doesn’t save energy. Operators using software save energy.
Every EMIS success story is really a story about a feedback loop somebody committed to: measure, adjust, verify, repeat. Buy the tool that fits the loop you’ll actually run — not the demo that impressed the committee.
MEASURED RESULTS
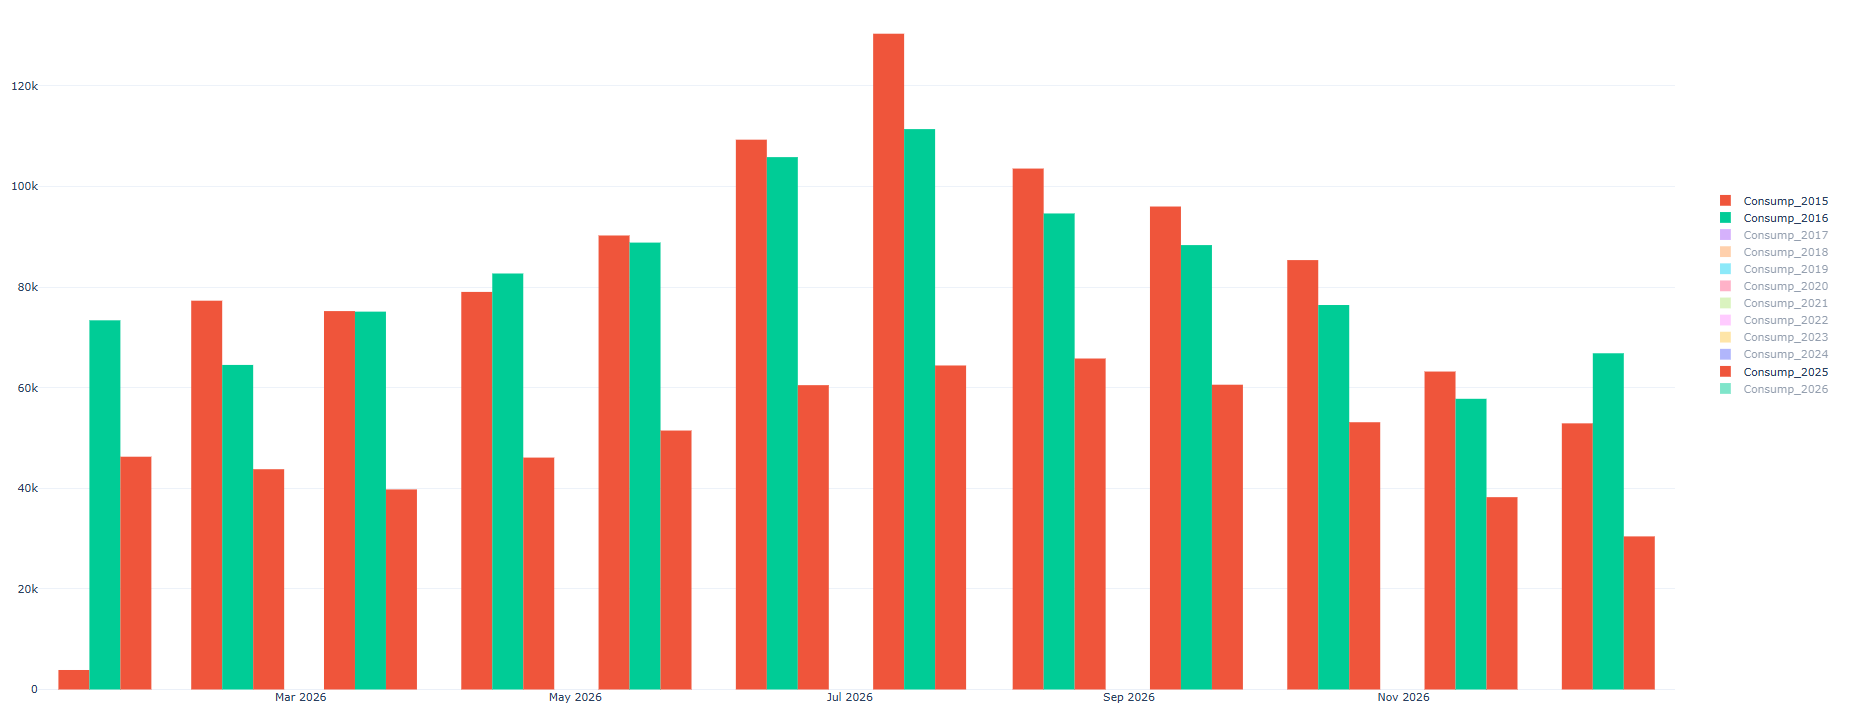
800 Wilcrest Dr, 2015–2025
Yearly energy consumption: roughly a 50% reduction from 2015 to 2025 (time-normalized, not weather-normalized), with no comfort sacrifice.
See 800 Wilcrest Dr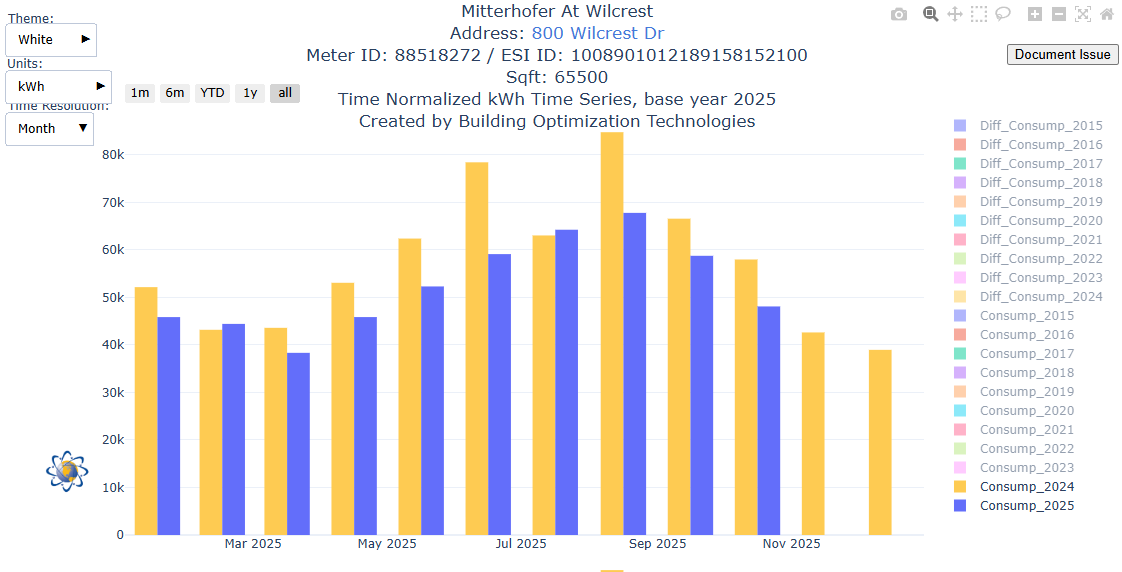
MEASURED RESULTS
The 2025 BAS beta
An additional ~25% year-over-year reduction in 2025 after the in-house BAS beta (installed around March 2025) began optimizing airflow and scheduling — enhanced version rolling out mid-2026.
See 800 Wilcrest DrHow we run ours
Building Optimization Technologies operates the four G&W Holdings buildings on exactly this architecture — continuous interval monitoring feeding daily operating decisions, peak-season choreography, and openly published ERCOT 4CP reports. It’s the working definition of our tagline, efficiency through data — and tenants collect the dividend as comfort and predictable Gross Modified rates.
See the analytics loop running in real buildings
Four Class A West Houston buildings operated on live interval data — with the peak-season results on the record.
Explore the portfolio The optimization playbook