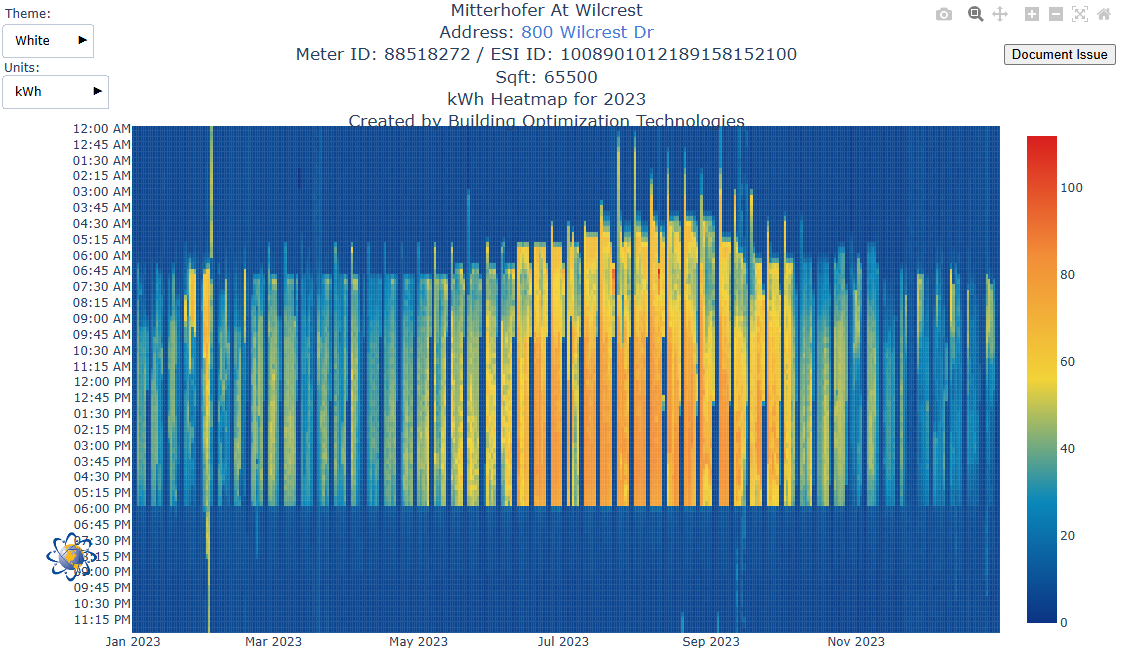
Texas allocates a big share of its transmission system costs with a mechanism that sounds like trivia and behaves like money: 4CP — the Four Coincident Peaks. Each summer month from June through September, ERCOT records the single 15-minute interval when grid-wide demand peaks. For larger commercial and industrial meters, your average demand during those four intervals sets your transmission cost responsibility for the following year. Use less during exactly those windows, pay less for twelve months. That’s the whole game — the play is in the details.
Why Texas does it this way
Transmission infrastructure is built to survive the system’s worst moments, so ERCOT assigns its costs according to who’s leaning on the grid at those moments. It’s rough justice with a useful side effect: it pays every large consumer to flatten the exact peaks that strain the grid — alignment between your bill and the system’s health.
The catch: nobody tells you when
The peak interval is only known after the month ends. Summer weekday afternoons — typically in the late-afternoon window when air-conditioning load crests — are the danger zone, but the specific quarter-hour is a forecast problem. So the discipline looks like this:
- Watch the forecasts. System load projections and real-time conditions flag likely peak days; the hottest stretches of each month earn the most respect.
- Pre-cool and coast. Cool the building ahead of the risk window, then float setpoints and shed staged equipment through it — the same choreography as demand response, aimed at a forecast instead of a dispatch.
- Automate the response. Peak windows arrive on hot afternoons with everyone busy; buildings that respond via the BAS respond every time. Buildings that rely on someone remembering, don’t.
- Verify with interval data. After each month, check your meter’s draw during the published peak interval — that’s the scoreboard.
We publish our 4CP season openly
Building Optimization Technologies tracks ERCOT peak season for our own four-building West Houston portfolio and publishes the 4CP reports — forecast calls, response actions, results.
Partly because transparency keeps us sharp; partly because “efficiency through data” should be visible, not asserted. If you want to see what disciplined 4CP management looks like in a real portfolio, ours is on the record.
TRY IT LIVE
Demand Response apparatus
Real daily peaks from 11111 Wilcrest Green — drag the demand cap yourself and watch what shaving the top of the curve is worth in dollars.
Open the apparatusTRY IT LIVE
Energy Heatmap apparatus
A year of any of our buildings as one picture, built from live 15-minute interval data — the same resolution 4CP is scored on.
Explore the heatmapWho should care, and how much
The mechanism’s direct force lands on larger meters — applicability and billing mechanics depend on your meter class, delivery utility, and supply contract, so confirm how 4CP flows through your tariff. But the operational lesson generalizes to every building in Texas: late summer afternoons are when electricity is most consequential — for 4CP, for demand charges, for wholesale prices. Buildings tuned to be gentle in those hours win on every scoreboard at once, which is why 4CP discipline is really just good operations wearing a Texas hat.
Lease in buildings that play 4CP season properly
Four Class A West Houston buildings, continuously monitored, peak season tracked and published — operating discipline your rate benefits from.
Explore the portfolio Summer cost playbook for tenants