Commercial electric bills price two different things. Energy (kWh) is total consumption — the marathon. Demand (kW) is your highest rate of draw, typically measured over 15-minute intervals — the sprint. Demand charges exist because the grid and your utility must build capacity for your worst quarter-hour, not your average one. Which means one careless Monday morning — every system starting at once after a hot weekend — can set a peak the whole month’s bill remembers.
Where accidental peaks come from
- Simultaneous morning starts. Chillers, air handlers, and pumps all commanded on at 7:00:00 — the classic self-inflicted spike.
- Recovery after setback. Deep weekend setbacks that force Monday recovery sprints trade small kWh savings for large kW penalties.
- Coincident equipment habits. Water heaters, kitchen gear, and process loads that happen to align with the HVAC crest.
- Ratchets. Some tariffs bill a floor based on your worst recent peak for months afterward — one bad interval with a long memory. Check whether yours does.
MEASURED RESULTS
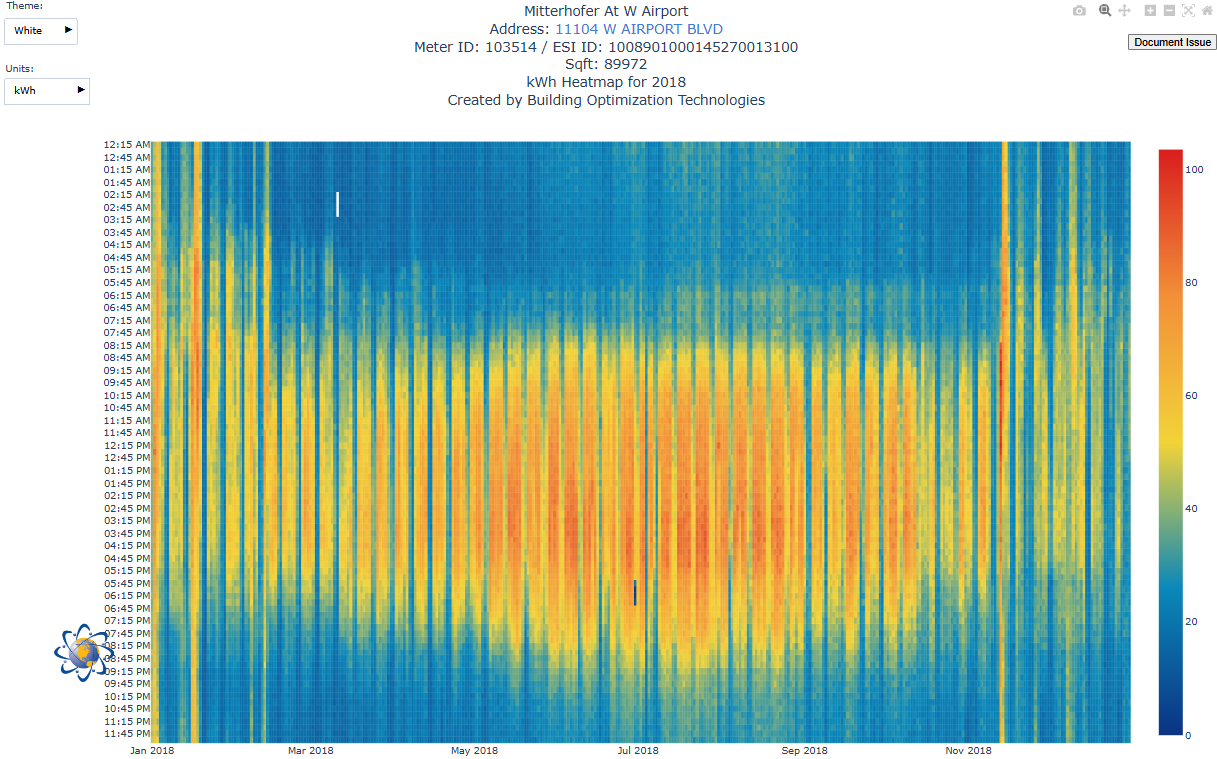
11104 West Airport, 2018 baseline
Interval-data heatmap at acquisition: 27 rooftop units with poor scheduling, and the off-hours and weekend waste to show for it.
Visit the building page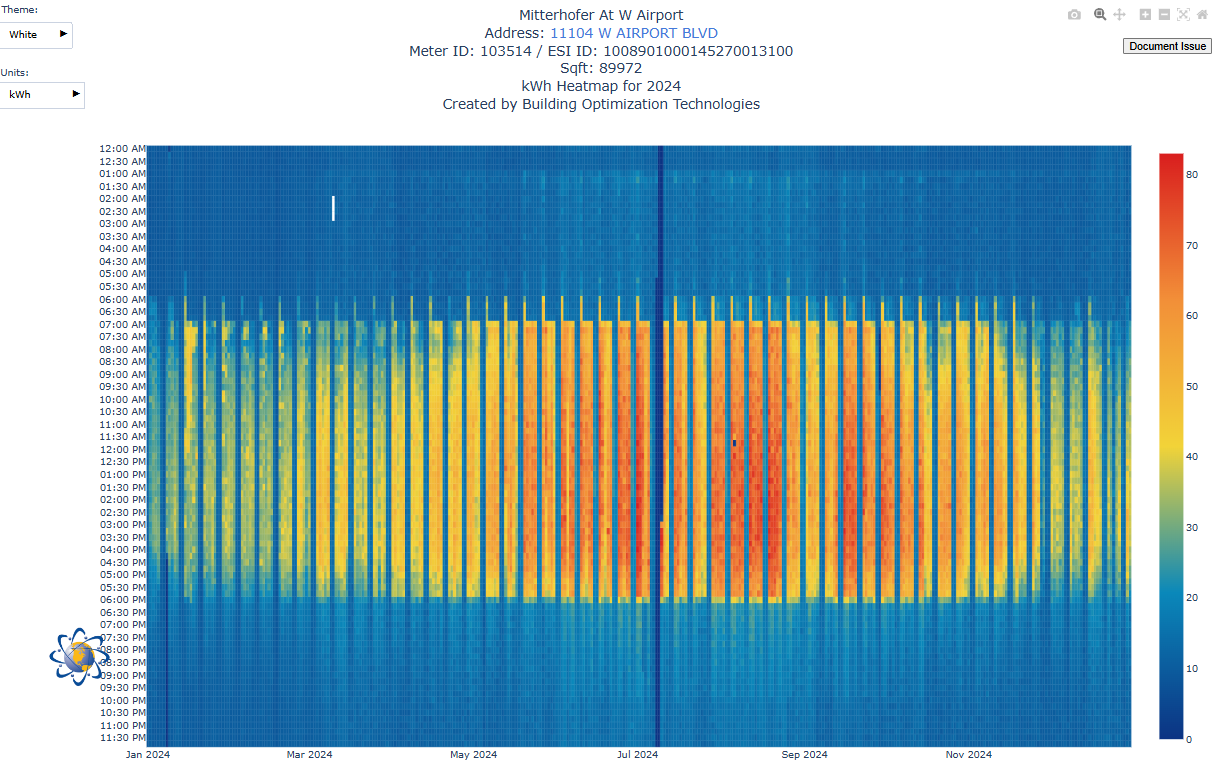
MEASURED RESULTS
Same building, 2024
Custom smart thermostats on all 27 RTUs, defined operating windows, and strong night setback — annual electricity down about 36% from 2018 to 2025 (time-normalized).
Visit the building pageThe peak-shaving playbook
- Stagger starts. Sequence morning startup in waves — minutes apart — instead of a single surge. Often the single cheapest fix in the book, executed entirely in BAS programming.
- Pre-cool into the cheap hours. Build cooling ahead of the afternoon crest, then let the building coast through it with floated setpoints.
- Set demand ceilings. Use monitoring to alarm — or automatically shed staged, non-critical load — as draw approaches a target threshold.
- Move the movable. Anything schedulable (pumping cycles, charging, heavy runs) belongs outside the building’s natural peak window.
- Verify with interval data. Pull your meter’s 15-minute profile monthly. The spikes tell you exactly where the money went — and whether your fixes are holding.
Texas doubles the stakes
On ERCOT, the demand game has a second scoreboard: the four summer coincident peaks (4CP) that allocate next year’s transmission costs for larger meters.
The same flattening discipline wins both — which is why Texas buildings that take demand seriously treat summer afternoons as the season’s main event. Full mechanics in our 4CP explainer.
TRY IT LIVE
Demand Response apparatus
Real daily peaks at 11111 Wilcrest Green — drag the demand cap and watch the dollars move.
Open the apparatusTRY IT LIVE
Load Duration Curve
A year of real 15-minute intervals — all 35,040 of them — sorted, so you can see the peaks this article is about.
Try it liveThe honest hierarchy
Batteries and thermal storage get the headlines, and for spiky loads they can pencil. But the sober order of operations is: first, stop causing your own peaks (staggering, scheduling — nearly free); second, ride through the grid’s peaks (pre-cool and coast); third, price hardware once the cheap fixes are exhausted and the interval data proves what remains. Buildings that skip to step three buy capacity to absorb waste that programming would have deleted.
This is bread-and-butter work for Building Optimization Technologies across our own four West Houston buildings — continuous interval monitoring, staged starts, peak-season choreography — the unglamorous discipline that keeps operating costs, and therefore tenant rates, boring.
Demand discipline, demonstrated daily
Our buildings run the playbook this article describes — and publish the peak-season results.
Explore the portfolio How Texas power billing works