Here’s the pattern every energy engineer knows: a building’s systems were commissioned years ago for a tenant mix that’s since changed, schedules crept, overrides accumulated, a sensor drifted, and nobody’s looked because nothing is broken. The building still cools. It just does it the expensive way. HVAC optimization is the systematic un-creeping — and it’s the highest-return energy work in commercial real estate because the capital is already installed.
MEASURED RESULTS
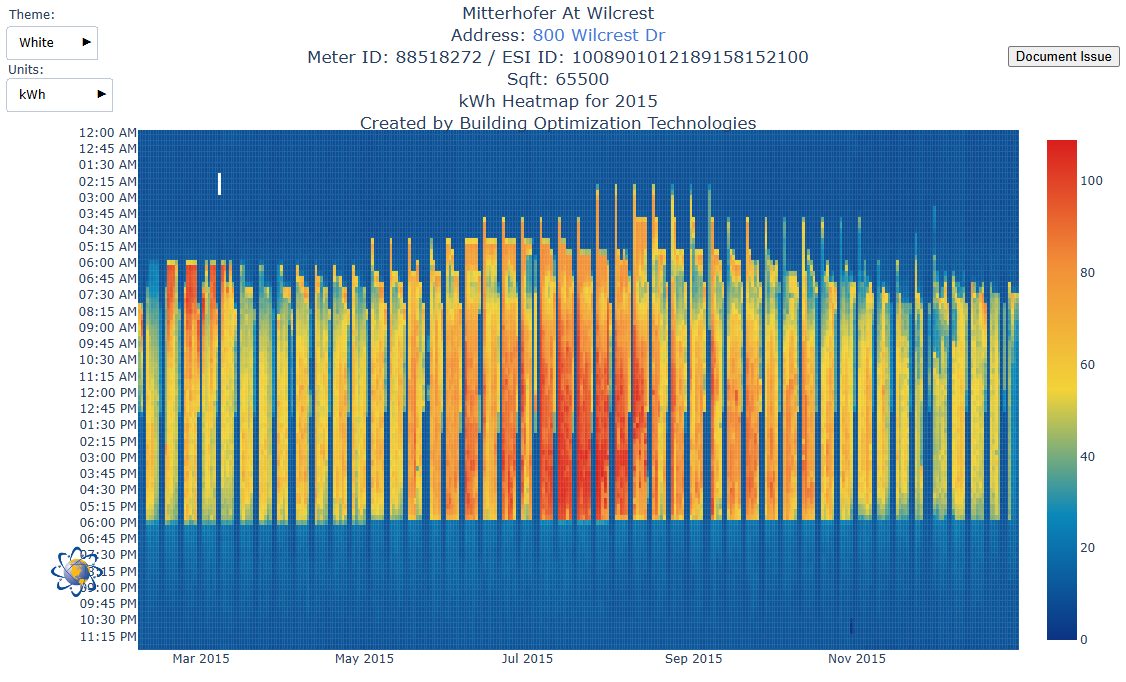
800 Wilcrest, 2015: the baseline
Hourly kWh heatmap under legacy operation — long HVAC runtimes and limited overnight setback. This is what schedule creep looks like in data.
Explore the live heatmap apparatus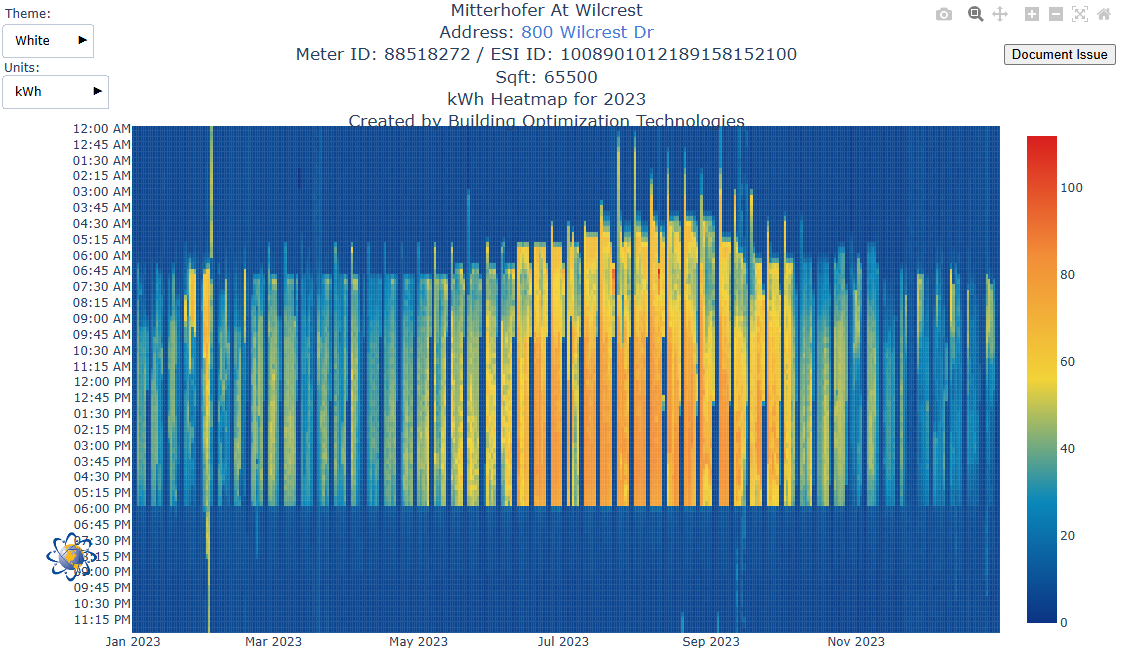
MEASURED RESULTS
The same building, 2023
After optimization: tight schedules, RTUs migrated to gas heating, and reduced winter electric demand — same building, same equipment class, different operating discipline.
See 800 Wilcrest DrThe optimization stack, cheapest first
- Schedules that match reality. Equipment running for occupancy that left years ago is the most common waste in the industry. Audit every schedule against actual use — including the “temporary” overrides that became permanent.
- Setpoints and deadbands. Sane zone targets with honest deadbands stop systems from fighting themselves — heating and cooling wrestling over the same air is a classic silent tax.
- Resets. Supply-air temperature and duct static-pressure resets let fans and cooling ease off when the building doesn’t need full effort — big savings written entirely in control logic.
- Economizers that actually economize. Free cooling from outside air is only free if dampers work and logic engages — economizer faults are among the most common (and invisible) failures in the fleet.
- Staging and startup choreography. Right-sequencing chillers and air handlers — and staggering starts — serves comfort and demand charges at once.
- Fault detection. With trending in place, drift announces itself in the data — a valve passing, a sensor lying, a unit short-cycling — long before tenants or bills do.
The prerequisite is visibility
Every item above assumes you can see the building: a functioning BAS with trending, interval metering, and someone — human plus analytics — actually watching.
Optimization without measurement is folklore. Measurement without action is a dashboard. The results live where both meet — the premise our whole operation is named for: Building Optimization Technologies.
TRY IT LIVE
Economizer Map
The hours Houston hands you free cooling — see when outside air can do the work instead of the chiller.
Open the Economizer MapTRY IT LIVE
VFD Affinity Curves
Slow a fan 20% and cut its power roughly in half — the physics behind the static-pressure resets described above.
Try the fan curvesKeeping it optimized (the part everyone skips)
Buildings drift — tenants change, seasons change, equipment ages. One-time tune-ups decay; the durable version is continuous optimization: monitor, adjust, verify, repeat — with savings checked against measured baselines (the discipline formalized in M&V practice) rather than asserted. That loop is how we run our own four West Houston buildings, and why the results reach tenants as comfort and rates that stay predictable — the operating cost we don’t waste is margin nobody has to recover from the rent.
Optimization as a standing practice, not a project
Four Class A buildings tuned continuously on live data — the “efficiency through data” discipline, on display.
Explore the portfolio How we measure the savings